Discover the top 10 stocks that are great for buying and keeping for a long time. These stocks come from companies that are known for being strong and steady. They make products or offer services that people use a lot, almost every day. These companies are also really good at making money and have a history of growing over time. When you pick these stocks, you’re choosing businesses that are leaders in their fields, like technology, health care, and consumer goods. By holding onto these stocks, you could see your investment grow as these companies continue to succeed and expand in the future. This approach is like planting a tree; it might grow slowly, but over time, it can become big and strong, providing shade and fruit for many years.
1. Microsoft (MSFT)
Microsoft’s a great company that controls the entire software business office, almost everything. This company was considered dead absolutely dead Ten or twelve years ago when it was selling for a nine times PE. Current PE is 35 plus. It is insane that this is the first company I want to own is actually the best in my list of 2024 and almost forever.


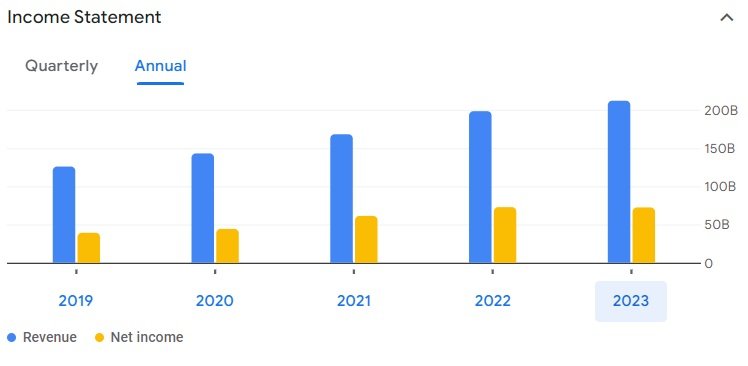
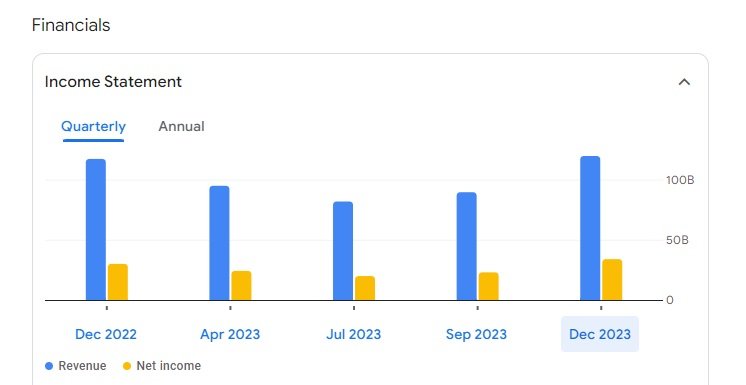
Microsoft 5 Year Growth Chart
So this stock has consistently beaten the market over the last 5 years with a share market cap of three trillion making it the largest in company in the World & Apple being second at the time of writing on Feb 2024. PE is around about 37 and the dividend payout is around 0.7% paid quarterly.
Microsoft Acquisitions List
Here is a list of some notable acquisitions Microsoft has made, including their acquisition prices (when publicly disclosed) and the year they were acquired. This list won’t cover all acquisitions but will highlight some of the most significant ones in terms of impact or purchase price.
| Year | Company Acquired | Field/Industry | Price |
|---|---|---|---|
| 1987 | Forethought | Software (PowerPoint) | $14 million |
| 2000 | Visio Corporation | Software (Diagramming) | $1.3 billion |
| 2007 | aQuantive | Advertising | $6.3 billion |
| 2011 | Skype | Telecommunications | $8.5 billion |
| 2013 | Nokia’s Devices and Services Division | Telecommunications | $7.2 billion |
| 2014 | Mojang | Video Games (Minecraft) | $2.5 billion |
| 2016 | Social Networking for Professionals | $26.2 billion | |
| 2018 | GitHub | Software Development Platform | $7.5 billion |
| 2020 | ZeniMax Media | Entertainment and Gaming | $7.5 billion |
| 2021 | Nuance Communications | Artificial Intelligence | $19.7 billion |
Please note that the prices listed are based on publicly available information and might not reflect the final amounts paid after adjustments or additional agreements.
Microsoft Business Model
Microsoft segments its revenue into three primary categories: Productivity and Business Processes, Intelligent Cloud, and Personal Computing. The percentages can vary quarter by quarter, but I’ll provide a simplified example based on general trends observed in recent years.
| Business Segment | Description | Approximate Revenue Contribution |
|---|---|---|
| Productivity and Business Processes | Office, Office 365, LinkedIn, Dynamics | 35% |
| Intelligent Cloud | Server products, cloud services (Azure), enterprise services | 40% |
| Personal Computing | Windows, devices (Surface, Xbox), gaming, search advertising | 25% |
Details:
- Productivity and Business Processes: This segment includes revenues from the sale of Office and Dynamics products and cloud services, LinkedIn, and other productivity and business process applications.
- Intelligent Cloud: The largest segment, showcasing Microsoft’s strong emphasis on cloud computing, includes income from Azure, server products, and enterprise services.
- More Personal Computing: This segment captures revenues from selling Windows operating system licenses, devices (Surface
and Xbox gaming consoles), gaming (including software and services), and search advertising.
If the stock is undervalued then Microsoft keeps on buying back company shares and keeps stock value going up. Buying back shares rewards the investors with confidence and value growth.
Let’s have a look at free cash flow from operating activities: As of September 2023 Microsoft has $143.94 Billion in hand.
Having a substantial amount of cash on hand will allow MSFT to be more flexible and secure. It enables them to invest in new projects, research, and development without needing external financing. Microsoft can also quickly respond to unexpected opportunities or challenges, such as making strategic acquisitions or navigating economic downturns. Additionally, a strong cash reserve can improve MSFT’s credit rating, reducing the cost of borrowing. Essentially, it provides a financial buffer that can support growth and ensure stability in uncertain times.
Microsoft is expected to grow over the next 5 years by about 14% annually.
Microsoft Stock Prediction
2. Google (GOOGL)
Google is probably the most reasonably valued of all of the magnificent seven. We know those magnificent seven it’s reasonably valued I believe that I can justify Google’s price today. However, I’m probably not going to get an outsized return for it So am I trying to be a little greedy maybe? But that’s where I stand in Google, they dominate the search market. The top two search engines in the world are YouTube and Google YouTube and Google I just saw the other day teenagers spend 93% of their time on YouTube and 63% of their time on TikTok So Google is the great one.
Google has an enterprise value of around 1.85 trillion. Google has a great balance sheet that looks around $70 billion in free cash flow, last year they had around 54 billion. They have a free cash flow of 26 and PE of 24 feels a little high but when you have such a high and growing return on invested capital of 11% Y/Y and 150% over the 5 last years it shows me that this is the kind of company that can reinvest back in itself.

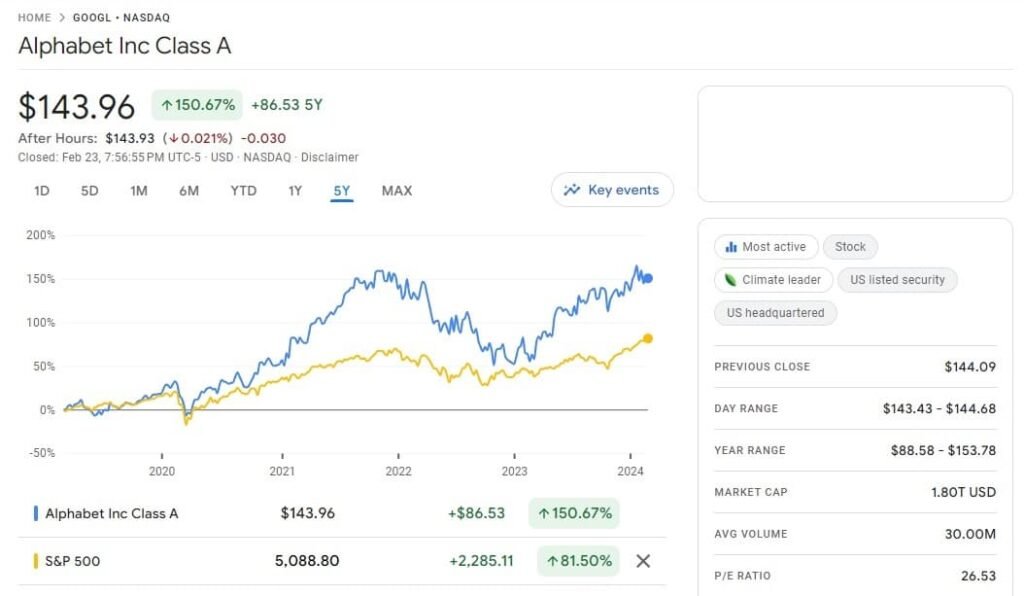
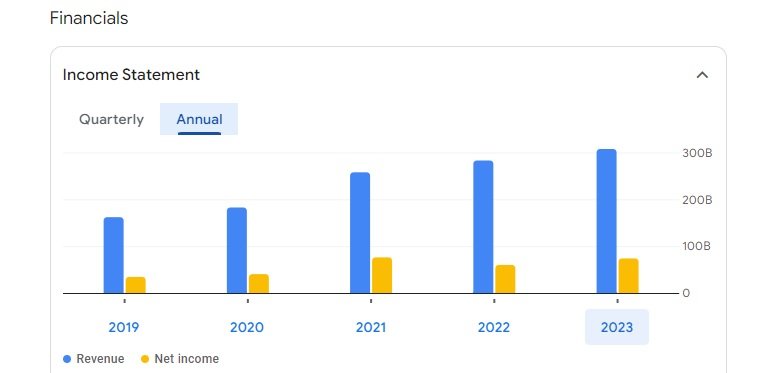
Google 5 Year Growth Chart
Google Acquisition List: (Most Common)
Here is a comprehensive list of most famous Google acquisitions in recent years. This is a monumental task by Google due to the sheer number of acquisitions made over the years.Please note that these values may vary and are subject to change over time due to various factors such as adjustments, undisclosed terms, etc.
| Company | Category | Acquisition Price | Year |
|---|---|---|---|
| YouTube | Video Streaming | $1.65 billion | 2006 |
| DoubleClick | Advertising | $3.1 billion | 2007 |
| Motorola Mobility | Hardware | $12.5 billion | 2012 |
| Waze | Navigation | $966 million | 2013 |
| Nest Labs | Home Automation | $3.2 billion | 2014 |
| DeepMind Technologies | Artificial Intelligence | $500 million | 2014 |
| Dropcam | Home Automation | $555 million | 2014 |
| Firebase | Web Development | $1 billion | 2014 |
| Apigee | Cloud Computing | $625 million | 2016 |
| Kaggle | Data Science | Undisclosed | 2017 |
| Looker | Business Intelligence | $2.6 billion | 2019 |
| Fitbit | Wearables | $2.1 billion | 2019 |
| Looker | Business Intelligence | $2.6 billion | 2019 |
| Fitbit | Wearables | $2.1 billion | 2019 |
| Chronicle | Cybersecurity | Undisclosed | 2019 |
| Elastifile | Cloud Computing | Undisclosed | 2019 |
| Alooma | Cloud Computing | Undisclosed | 2019 |
| Socratic | Education | Undisclosed | 2019 |
| North | Wearables | $180 million | 2020 |
| Typhoon Studios | Gaming | Undisclosed | 2020 |
| Looker | Business Intelligence | $2.6 billion | 2019 |
| Fitbit | Wearables | $2.1 billion | 2019 |
| Looker | Business Intelligence | $2.6 billion | 2019 |
| Fitbit | Wearables | $2.1 billion | 2019 |
| Chronicle | Cybersecurity | Undisclosed | 2019 |
| Elastifile | Cloud Computing | Undisclosed | 2019 |
| Alooma | Cloud Computing | Undisclosed | 2019 |
| Socratic | Education | Undisclosed | 2019 |
| North | Wearables | $180 million | 2020 |
| Typhoon Studios | Gaming | Undisclosed | 2020 |
| Looker | Business Intelligence | $2.6 billion | 2019 |
| Fitbit | Wearables | $2.1 billion | 2019 |
Google Business Model
Google’s business model primarily revolves around advertising, digital products, and services. Here’s a simplified overview of its major components:
Advertising: This is Google’s primary revenue source. It includes:
- Search Advertising: Through Google AdWords, businesses pay to have their ads appear in Google’s search results based on specific keywords.
- Display Advertising: Through Google AdSense, Google places ads on participating websites outside of its search engine. Website owners earn money based on clicks or impressions of these ads.
- YouTube Advertising: Ads are shown before or during videos on YouTube, with revenue shared with content creators.
Cloud Computing Services: Google Cloud Platform (GCP) offers computing resources and services like data storage, machine learning, and analytics to businesses and individuals.
Hardware Products: Google designs and sells hardware, including the Pixel smartphones, Google Nest smart home products, and Google Chromebooks.
Software and Digital Services: This includes:
- Android Operating System: Google develops Android, which is used by various smartphone manufacturers. Revenue is generated through the Google Play Store from app sales, in-app purchases, and app advertising.
- Subscription Services: Google offers subscription-based services such as YouTube Premium, Google One (cloud storage), and Google Workspace (productivity tools for businesses).
Other Ventures: Google, through its parent company Alphabet Inc., invests in various sectors like self-driving technology (Waymo), health technology (Verily), and more, exploring new revenue streams beyond its core business.
Here’s a table illustrating Google’s business model with estimated percentages of total revenue across different streams:
| Revenue Stream | Estimated Percentage of Total Revenue |
|---|---|
| Advertising | 80% |
| Cloud Computing | 10% |
| Hardware | 5% |
| Subscription Services | 3% |
| Other Revenues | 2% |
This table provides a generalized view of how Google’s revenue is distributed across its various business segments.
Google Stock Prediction
3. Facebook (META)
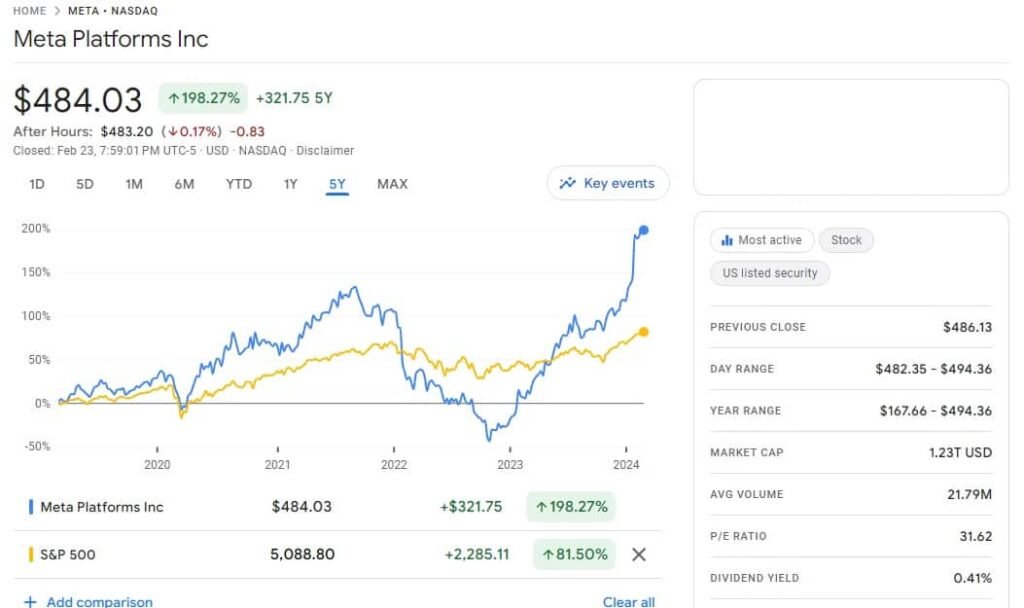
Meta back on November 4 2022 was at $88 a share. It is now around $380 a share It’s up over four times in the last one year. This company controls Facebook, Instagram, & WhatsApp. Three and a half to 4 billion of the world’s 8 billion people use meta products every single day. This is the company that blew out Wall Street’s expectations when earnings went up 20%.
Meta is generating amazing cash flow and has not maximized their revenue per user yet. So I love that for meta stock.
During 2024 I have a feeling that this stock is going to be on a bullish trend for time to come why because they gave us a great earnings report and made a couple of shareholder-friendly moves. Meta company announced a 50 Cent per share dividend this is the first ever for Meta. Remember back when Apple did this they declared a special dividend this is the kind of thing that long-term investors love people who have it in their 401ks their Ira all of that they love to see companies pay dividends. This returns Capital to shareholders that’s why we all get into this right?
The second most important thing is they announced $50 billion in additional funds as a stock buyback program so they’re going to be buying more of those shares. Scarcity is a great thing when it comes to Wall Street and investing and the Company’s trying to again return some of that Capital by buying back those shares so two moves are going to put Meta in the long-term Bulls category.
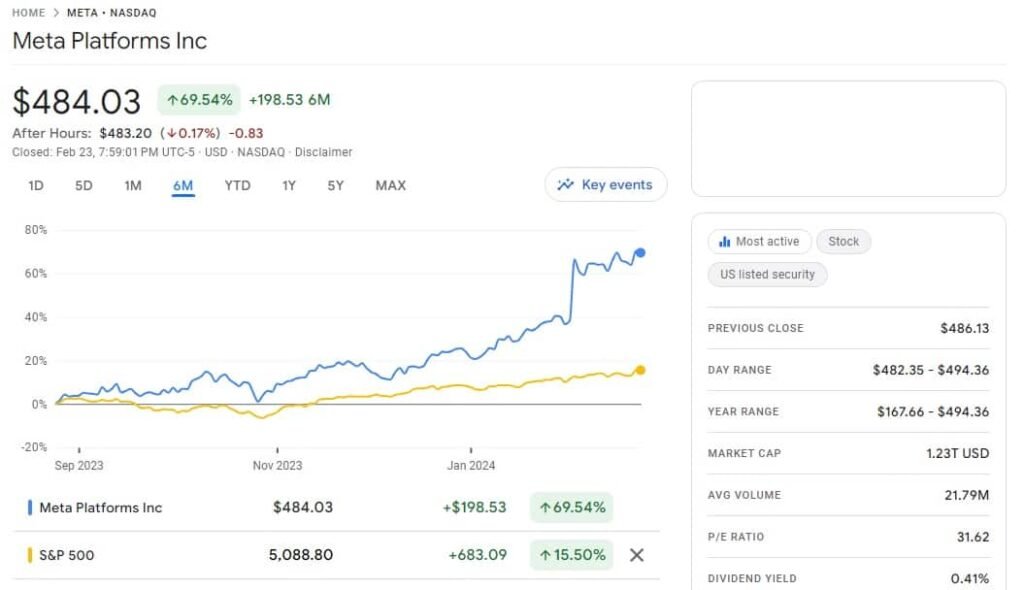
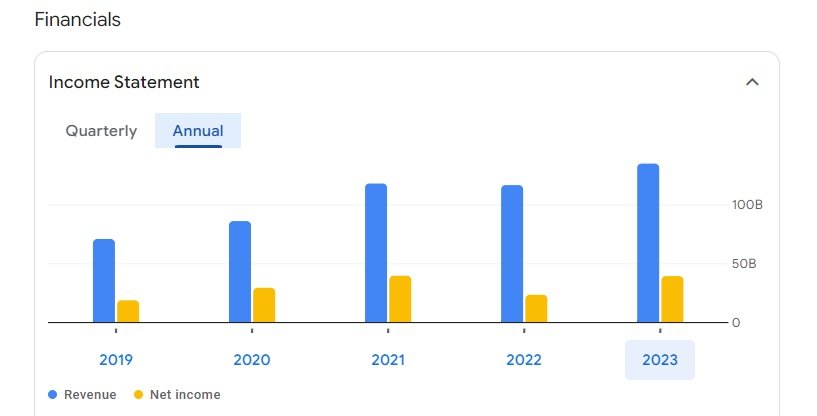
META revenue in their Q3, 2023 earnings total revenue Rose by 25% year on-year to over 40 billion, and net profit tripled to $4 billion both significantly higher than analyst’s expectations on top of these impressive numbers. Zuckerberg also surprised investors by announcing that Meta would be paying its first dividend of 50 cents per share. For context Dividends are a bit of a rarity in Silicon Valley both because Market capitalizations have been growing fast enough to satisfy investors.
Just the day after the dividend announcement Meta’s stock Rose by an amazing 20%. According to Bloomberg, this means that Meta’s market capitalization jumped by $197 billion in a single day the biggest ever one-day increase in stock market history. Clearly Meta is back and stronger than ever before.
Meta Acquisitions List:
Meta Platforms, Inc. (formerly known as Facebook, Inc.) has made numerous acquisitions over the years, spanning various categories such as social networking, virtual reality, and artificial intelligence, among others. Below is a list of some notable acquisitions by Meta, categorized by their primary focus and including the purchase price where available. Please note that the prices of some acquisitions were not publicly disclosed or are based on media reports, as not all details might have been officially confirmed by Meta:
| Acquisition | Year | Category | Price (USD) |
|---|---|---|---|
| 2012 | Social Media | $1 billion | |
| 2014 | Messaging | $19 billion | |
| Oculus VR | 2014 | Virtual Reality | $2 billion |
| Giphy | 2020 | GIFs & Animation | $400 million |
| CTRL-labs | 2019 | Neural Interfaces | Between $500 million and $1 billion |
| Onavo | 2013 | Mobile Analytics | Estimated $100-200 million |
| tbh | 2017 | Social Networking | Less than $100 million |
| Beat Games | 2019 | VR Gaming | Undisclosed |
| Mapillary | 2020 | Mapping | Undisclosed |
| Kustomer | 2020 | Customer Service | $1 billion |
META Business Model
Here’s a table illustrating META’s business model with estimated percentages of total revenue across its primary revenue streams:
| Revenue Stream | Estimated Percentage of Total Revenue |
|---|---|
| Advertising | 98% |
| Virtual Reality & Hardware | 1% |
| Payments & Other Fees | 1% |
This information only provides a generalized view of how META’s revenue is distributed across its various business segments. The vast majority of revenue comes from advertising, reflecting the core of META’s business model, while contributions from virtual reality, hardware, and other fees constitute smaller portions.
META Stock Prediction
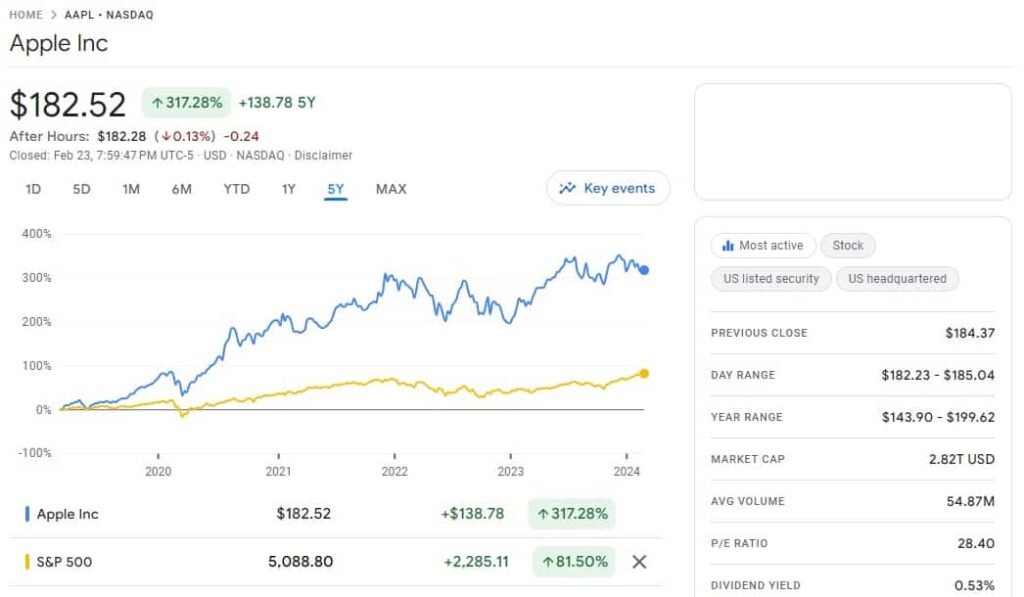
4. Apple (AAPL)
The tech giant Apple Inc ticker symbol AAPL, in the first half of 2023 Apple experienced a remarkable surge in its stock price soaring from $125 to $198 by July marking a remarkable 58% increase however since then the stock has maintained a range-bound pattern fluctuating between $165 and $198. It is noteworthy by the way that Apple holds a prominent position in the Investment Portfolio of Warren Buffet.
Berkshire Hathaway with over 95 million shares constitutes 1th of Berkshire’s entire Holdings I believe that 2024 will be a great year for Apple and the stock will finally be able to break above the key level of $200. Apple may have lost its top position as the world’s most valuable public company to Microsoft but its fundamental analysis reveals a resilient powerhouse poised for Resurgence despite recent shifts in market dynamics.
Apple’s expansive ecosystem boasting over 1 and a half billion users and unparalleled brand loyalty sets a sturdy foundation for growth while iPhone sales growth May Plateau due to Market saturation Services emerge as a beacon of potential promising exceptional growth prospects Additionally the release of the groundbreaking Vision Pro device hints at a transformative era reminiscent of the iPhone’s Inception with valuation metrics indicating an attractive entry point Apple presents a compelling case for investors eyeing long-term.

iPhone’s worldwide expansive reach not only provides a vast target audience but also lays a solid foundation for sustained Revenue expansion. However, the true strength of Apple’s services lies not just in its numbers but in the unwavering loyalty of its customers with a remarkable 79% customer loyalty rate and an impressive 90% % retention rate.
Apple’s brand remains a formidable force in the market this steadfast loyalty affords Apple the flexibility to implement strategic pricing adjustments without compromising its brand Integrity a testament to its enduring appeal. Moreover, as technology continues to evolve Apple’s commitment to Innovation ensures that it remains at the Forefront of Emerging Trends and the rapid integration of artificial intelligence also known as AI capabilities, opens up new avenues for service offerings.
Vision Pro holds promise as a potential GameChanger poised to supercharge Apple’s long-term growth prospects
Apple Acquisition List
Here are some notable acquisitions by Apple:
| Acquisition | Year | Category | Price (USD) |
|---|---|---|---|
| Beats Electronics | 2014 | Audio | $3 billion |
| Shazam | 2018 | Music Recognition | Estimated $400 million |
| Anobit | 2012 | Semiconductors | Estimated $390 million |
| PrimeSense | 2013 | 3D Sensing | Estimated $360 million |
| Turi | 2016 | Machine Learning | Estimated $200 million |
| Lattice Data | 2017 | Data Analysis | Estimated $200 million |
| Texture | 2018 | Digital Magazines | Undisclosed |
| Xnor.ai | 2020 | AI on the Edge | Estimated $200 million |
| Voysis | 2020 | Voice Recognition | Undisclosed |
| Dark Sky | 2020 | Weather Apps | Undisclosed |
This table highlights a range of strategic acquisitions by Apple, aimed at bolstering its capabilities in various technological domains.
Apple Business Model
Apple’s business model is multidimensional and is focused on a range of products and services that interconnect to provide a seamless ecosystem for its users.
This ecosystem strategy not only drives sales across different product lines but also locks in users to Apple’s platform, encouraging further purchases and subscriptions. B
iPhone: The flagship product of Apple, generating the largest share of the company’s revenue. The iPhone’s success is attributed to its innovative features, design, and integration within Apple’s ecosystem.
Services: A rapidly growing segment, including the App Store, Apple Music, iCloud, Apple Pay, Apple TV+, Apple Arcade, and Apple News+. This category represents a significant and growing part of Apple’s revenue, driven by subscriptions and sales within the ecosystem.
Mac: Apple’s line of personal computers, including the MacBook Air, MacBook Pro, iMac, Mac Pro, and Mac mini. The Mac segment contributes to Apple’s revenue through hardware sales and is supported by macOS and various professional applications.
iPad: Apple’s line of tablets, which has found a market among consumers, businesses, and the education sector. The iPad segment generates revenue through the sale of hardware and compatible accessories.
Wearables, Home, and Accessories: This category includes the Apple Watch, AirPods, HomePod, Apple TV, and various accessories like cases, chargers, and keyboards. It’s a growing segment that extends Apple’s ecosystem to wearable technology and home products.
Other Products and Services: This could include emerging technologies, patent licensing, and other miscellaneous sources of revenue not captured in the main categories.
Here is an estimated percentages share of Apple’s business model revenue:
| Revenue Stream | Estimated Percentage of Total Revenue |
|---|---|
| iPhone Sales | 50% |
| Services (App Store, Apple Music, iCloud, etc.) | 20% |
| Mac and iPad Sales | 20% |
| Wearables, Home, and Accessories (Apple Watch, AirPods, etc.) | 10% |